Neutron Powder Diffraction Facility
Introduction to Neutron Diffraction
In the development of new materials, the goal is usually to understand the connection or correlation between material properties and materials structure. The steppingstones to this understanding are the fundamental crystal structure, the position and chemical species of the constituent atoms, the species, location, concentration of impurities and the nature of the specimen structural defects.
Neutrons are Wonderful!
Neutron powder diffraction is complementary to other materials characterization methods, such as X-ray diffraction. Neutron diffraction is usually used in a highly specialized way to provide critical information or carry out a in-situ experiment. Although superficially similar to X-ray diffraction, neutron diffraction has many advantages:

- Contrast. Neutron scattering length is not dependent on the atomic number. It is possible to observe the light atoms, such as H, Li, and distinguish the adjacent elements in the periodic table.
- Isotopes. Neutron scattering length is isotope dependent. Isotopic substitution can be used to study crystalline structures which contain high neutron absorbing elements, such as B, Gd, Cd, Sm, etc.
- Special Environments. Neutrons are usually deeply penetrating so they can diffract from specimens contained within cryo-refrigerator or furnaces, making it easy to examine materials under special conditions and in special environments.
- Calculable. Unlike the case for x-Rays, the scattering of neutrons from materials can be accurately calculated making comparison to theoretical.
- Magnetism. Neutrons have a magnetic moment, and their scattering is sensitive to the magnetic moment of atoms making neutron scattering the ideal means to study magnetic materials.
How it Works
When a polycrystalline specimen is bathed in a monochromatic (single wavelength) beam of neutrons, there are always many grains of the sample that are aligned to reflect the radiation according to Bragg’s Law – see figure below. The diffracted neutrons form cones of radiation corresponding to the many different atom plane spacings (d) in the crystals.

If a detector is arranged to scan through the scattered radiation, a series of peaks appears as a function of angle. The positions of the peaks (in angle) are determined, through Bragg’s Law, by the spacing of atoms in the specimen crystal structure. The intensity of the diffraction peaks is controlled by the positions and atomic species of the atoms in the unit cell (the fundamental crystal building block).
Using a technique called Rietveld Refinement, the diffraction pattern calculated from the model of the crystal structure compared to the data and the atomic positions, species and thermal vibrations in the model are adjusted until a good agreement with the experimental data is obtained. The result is the “refined” crystal structure for the specimen – examples – see figures below. Here the structure of ettringite, formed during the setting of ordinary Portland cement has been determined.


Neutron Powder Diffractometer Facility
The PULSTAR Neutron Powder Diffraction Facility and Microstructure Analysis Laboratory utilize the capabilities of the double-axis neutron diffraction system (see Figure below) installed at beamport #4 of the PULSTAR reactor.

Neutron Collimator & Filter
A six-inch thickness single crystal sapphire filter is employed as fast neutron filter and high energy radiation shielding since beam tube 4 is directly faced to the core.
Monochromator
Double focusing bent perfect single crystal monochromator. Focusing in the vertical plane is like a simple concave mirror. Focusing in the horizontal plane is by diffraction – i.e. the beam from the sample is focused on the detector. The monochromator consists of 9 silicon single crystal blades which are bent horizontally to a radius of 12.25 m. The vertical focusing is accomplished by mounting the blades with polygonal approximation to a radius of 1.44 m. The wavelength is 1.479 Å (511) and 1.762 Å (331). The photo of monochromator and its double focusing are shown in the figures below.

Oscillating Radial Collimator (ORC)
The Oscillating Radial Collimator (ORC) is a collimator with blades focused to the sample position. The blades are coated with GdO powder, which absorbs thermal neutron strongly. The neutrons scattered at the sample position can pass through the collimator, but the neutrons scattered at other positions will be stopped. The oscillating movement can average the shade of the blades and get a smooth background.

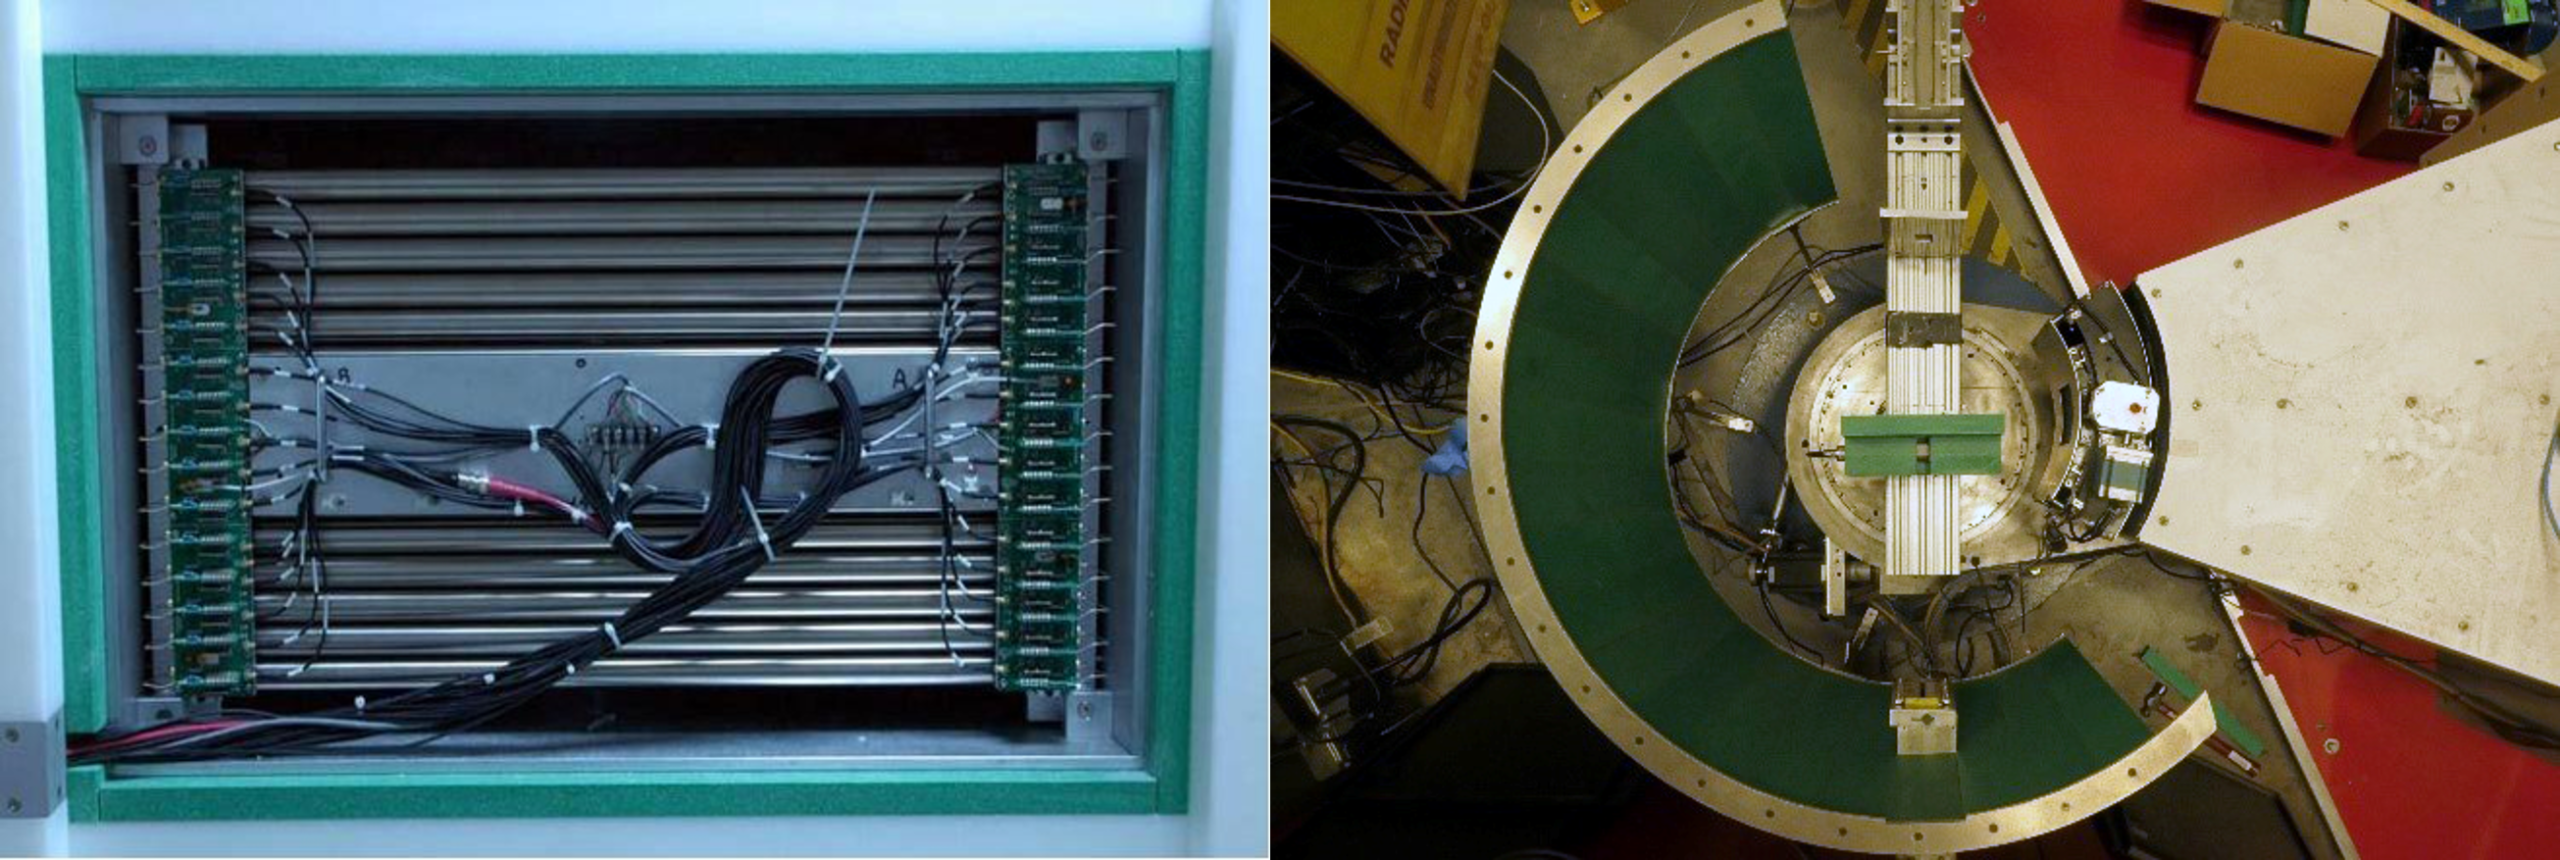
Neutron Detector Array
The PNPD detector contains 15 neutron linear position sensitive proportional counters. The detectors have an active length of 24″, a diameter of 1″ and are filled with 8 Atm 3Helium and 4 Atm Argon. Neutron detection is through the reaction: n + 3He –> 1H + 3H + 768 keV. The event position utilizes the charge division method. The neutron capture event injects charge on the detector anode which divides via the anode resistance resulting in signals from the preamplifiers connected to each end of the detector element. A simple model is sufficient to show the quotient of the preamplifiers signals yields the event position. The signals from the two preamplifiers connected to each detector element are processed by a custom microprocessor controlled dual-amplifier / dual-ADC circuit board that calculates and histograms the event positions and transfers these to the host computer on command. The detector can collect 400 points of data at one position, and 15 detectors are stacked in vertical direction which can give 15 inch vertical acceptance. The detector array is attached to a moveable cassette and can be moved from 15° to 115° to cover the entire range 5° to 125°.
The detectors collect data at each section for a fixed monitor count to ensure the incoming neutron at sample position is same for each section. This diffractometer is a low background, high data collection rate, and high-resolution diffractometer.
Example Spectra
Three example runs of NPDF are given in Figure 6. The first sample is a 0.25 inch diameter Al2O3 rod, which weight is about 13g. The total data collection time is about 0.7 hour. The second sample is silicon powder loaded in a 5 mm diameter vanadium holder, its weight is about 2.22g, and the data collection time is 3.6 hours. The third sample is silicon powder too, which is loaded in a 3mm diameter vanadium holder. Its weight is about 0.62g, and the data collection time is about 9.1 hours. All data have good statistic and signal/noise ratio.

Diffractometer Applications
Neutron diffraction data can be directly compared to theoretical models of crystal structure and composition. This opens a wide variety of possible applications:
- New material crystal structure and composition – In the development of new materials, the correlation of structure, synthesis conditions and properties is essential.
- Alloy atom location – The intensity of diffraction peaks is directly related to the atom species and fractional occupation of the crystal atom.
- Solid – Solid phase transformation – Many materials change their crystal structure in response to changes in their environment (temperature and pressure). New crystal phases result in new diffraction peaks – the unmistakable signature of phase transformation.
- Non-contact temperature measurement – The height of diffraction peaks is modulated by atomic thermal vibrations. Once calibrated, this can be an accurate means to measure temperatures when no other method is available.
- Chemical and solid-state reaction pathways and kinetics – Many chemical and solid-state reactions can be monitored quantitatively through the intensity of the diffraction peaks corresponding to the various components.
- Material stress – strain analysis – When crystalline materials are put under stress, the spacing between their atomic planes is changed. This results in a shift of the diffraction line positions. With neutron diffraction it is possible to probe material stress distributions in real engineering materials.
- Multiphase composition analysis – Many complex materials are mixtures – not alloys. Neutron diffraction measurements combined with Rietveld refinement can be used to analyze the composition and structure of the individual components.
We welcome requests for measurements and collaborations from both academic institutions and industrial partners. Please contact the Manager of Nuclear Services if you are interested in learning more about applications of the neutron powder diffractometer.